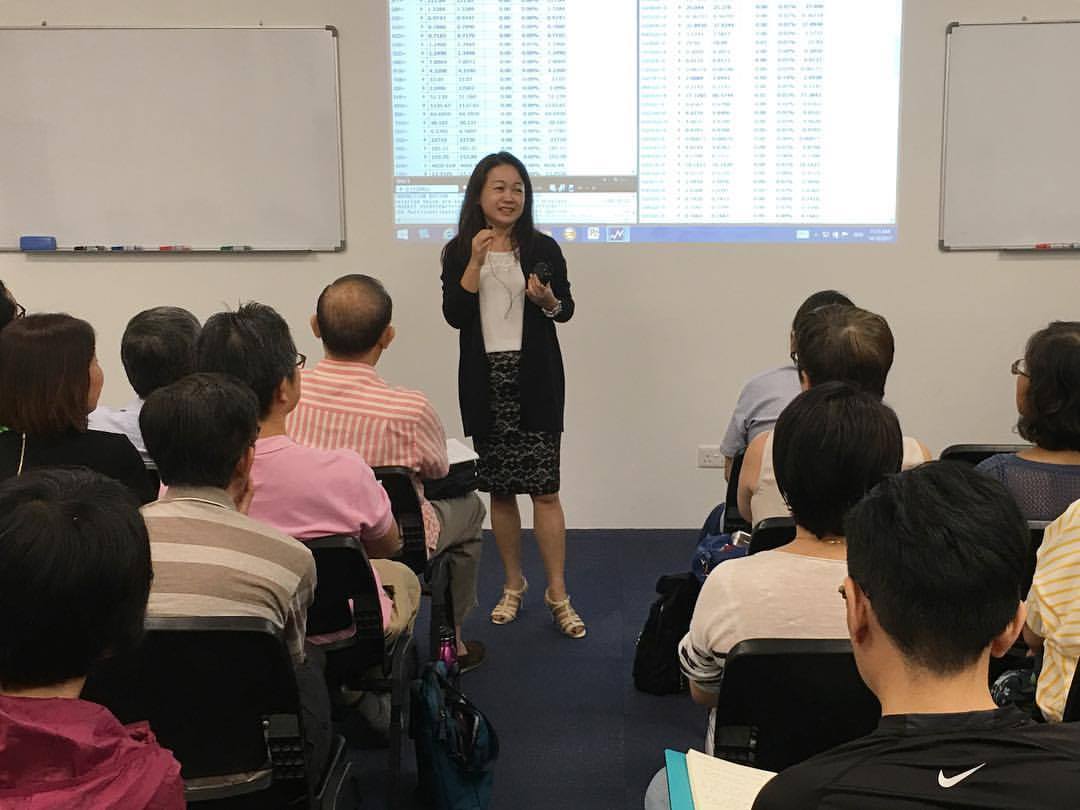
How To Use Price Charts And Technical Indicators To Time Your Trades
Date and time
Location
Level 6 Diamond Room
Raffles City Tower 250 North Bridge Road Singapore City, Singapore 179101 SingaporeDescription
A complimentary 3 hour workshop. You will be taught USEFUL & PRACTICAL tools and strategies for stock investment using charts and indicators.
Outlines:
- Sharpening your investment and trading edge through price charts and technical indicators, timing your entry and exit for higher probability trades.
- How to manage your risks through cash management and advance order types.
- Suitable for new and existing investors who would like to learn technical analysis to help them in making trading/investing decisions.
For further enquiries, please contact 97509313

Speaker Profile: Ms Ellain Tan, CFA, CFP
Industry Experience: >15 years in securities and wealth management
IMPORTANT NOTES FOR SEMINARS
Please note that under the Singapore Personal Data Protection Act (PDPA) 2012, Phillip Securities Pte Ltd respects the privacy of all our customers and visitors, and are committed to safeguarding the personal information you provided to us. For event registrations, you will be requested to provide your personal particulars, which include but are not limited to the following:
a) Full Name
b) Contact details, including telephone number/s and/ or email address
Please note that Phillip Securities Pte Ltd will send out “Email Confirmation”, Short Message Service (SMS), and events/seminars via email to all registrants for all Phillip Securities Pte Ltd events. All personal data held by Phillip Securities Pte Ltd will be kept confidential, will not use and disclose to third parties.